Overview
The Consent Segmentation Dashboard shows you how your visitors break down by consent status. At a glance you can see what share of your users accepted cookies and what share is captured exclusively through bchic Analytics (cookieless). This matters because traditional analytics tools like Google Analytics only see the consented portion. bchic shows you both sides and reveals how large your blind spot would be without cookieless tracking.Activating Consent Tracking
Before the dashboard shows any data, consent tracking needs to be set up. There are two ways: Option 1: Via the UI Open the Consent Segmentation Dashboard. If consent tracking is not yet active, you will see a notice with the Configure Script button. Click it and follow the instructions to update your tracking. bchic automatically detects common Consent Management Platforms (CMPs) such as Cookiebot, OneTrust, Usercentrics, or any IAB TCF v2 compatible CMP. Option 2: Manually in the Tracking Script Add thedata-track-consent="true" attribute to your bchic tracking script:
Finding the Dashboard
The Consent Segmentation Dashboard is located under User Behavior → Consent Segmentation in the sidebar. It only appears once consent tracking is active and at least some sessions with a consent status have been recorded.Dashboard Components
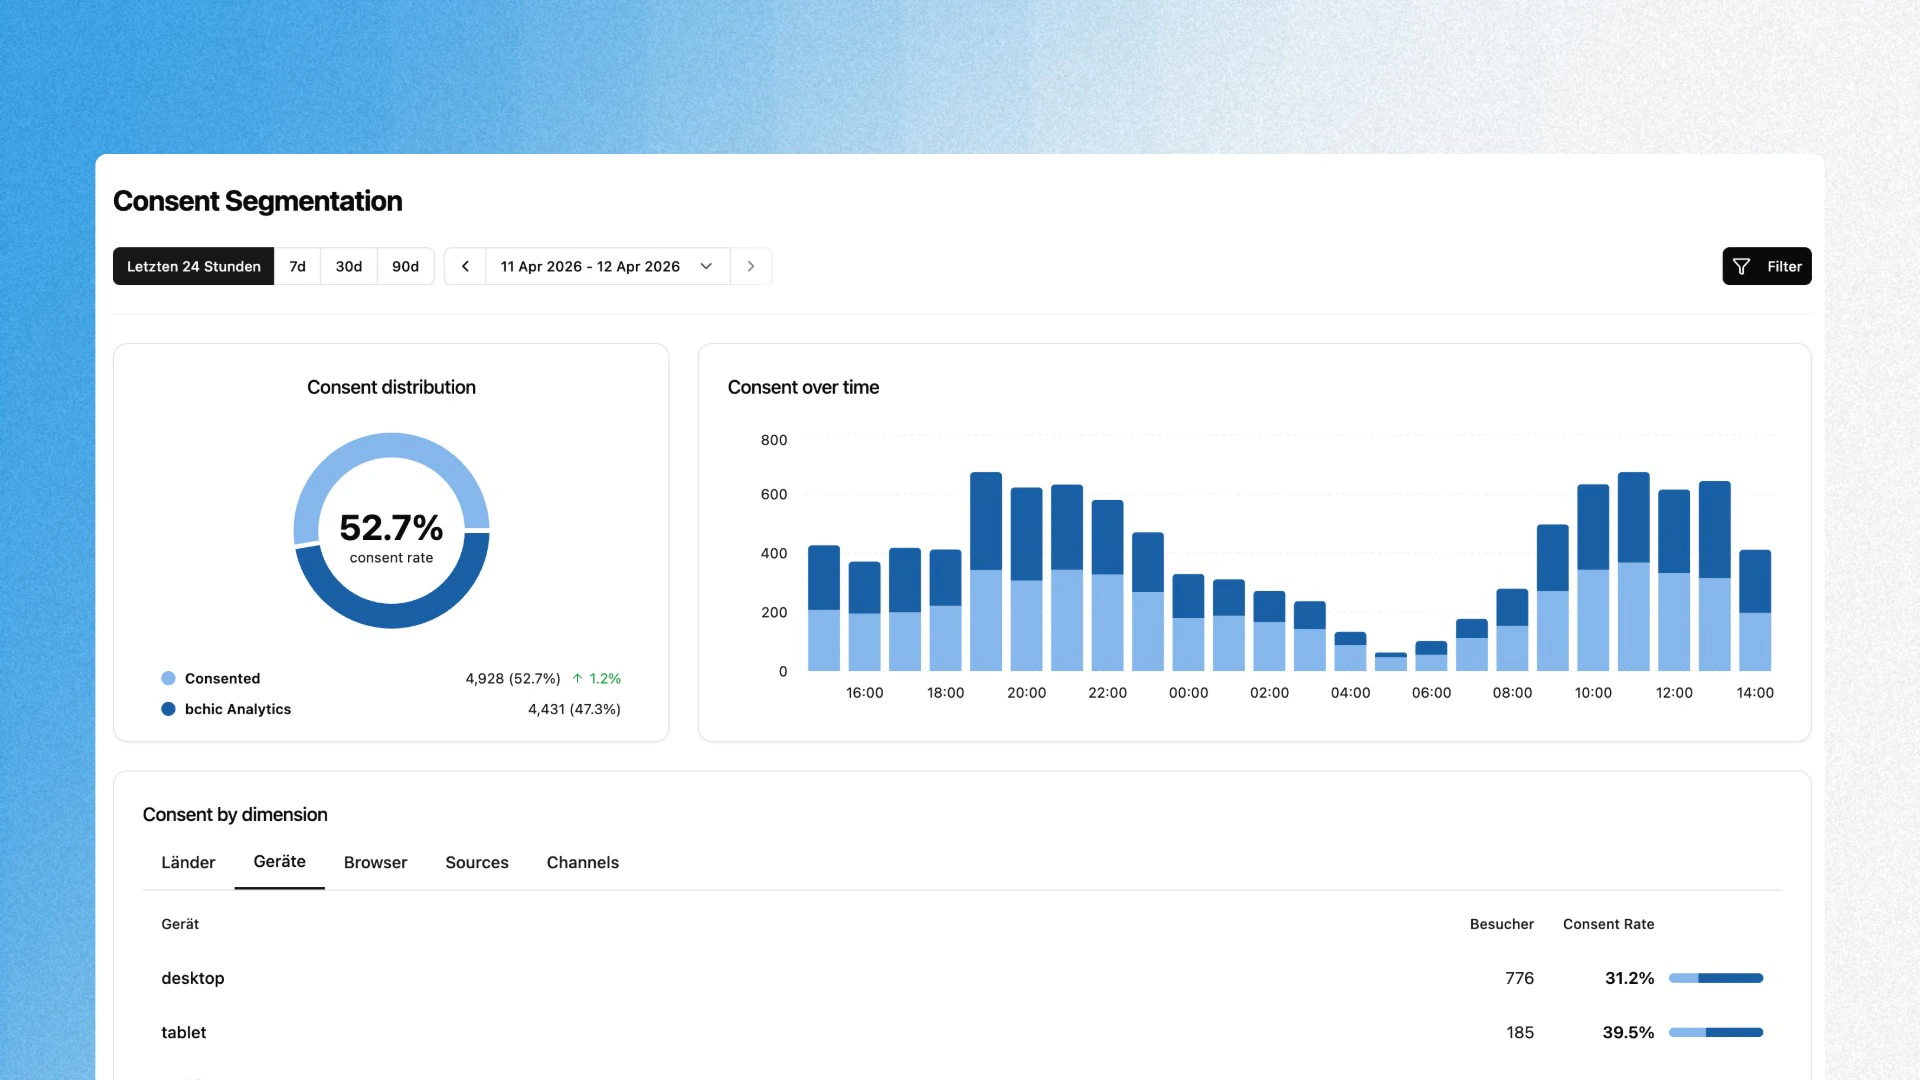
The dashboard consists of three main sections:Consent Distribution
The donut chart shows the overall distribution of your visitors by consent status:
The percentage in the center is the consent rate, the share of visitors with active consent out of all visitors. Next to it you see the absolute count per segment and the change in consent rate compared to the previous period.
Consent Over Time & Time to Accept
This card has two views that you can switch between using the tabs in the upper right. Consent shows a stacked bar chart with the distribution of consented and non-consented sessions over time. This helps you spot patterns: are there times of day or days of the week when the consent rate is particularly high or low? Time to Accept shows how long visitors take before they consent to the cookie banner. The view displays the median along with the P50, P75, P90, P95, and P99 percentiles as a bar chart. The median is shown as a headline above the chart.
A low median (under 3s) indicates a well-placed banner. Large jumps between P75 and P90 show that a portion of your users initially ignores the banner.
Consent by Dimension
The table at the bottom breaks down consent distribution by various dimensions. Switch between the tabs to analyze the consent rate by different attributes:
Each row shows the visitor count and the corresponding consent rate with a visual bar indicator.
Typical Analyses
Measure the blind spot A consent rate of 55% means that traditional analytics tools do not see 45% of your visitors. The Consent Segmentation Dashboard quantifies this data loss and makes it tangible. Evaluate CMP performance Time to Accept reveals whether your cookie banner is working. If the average exceeds 30 seconds, users are engaging late or ignoring the banner at first, a sign that its position or design should be revisited. Understand regional differences EU countries with strict GDPR enforcement typically have lower consent rates than non-EU countries. The countries dimension helps you assess whether your consent rate falls within the expected range. Compare traffic sources Paid traffic often has a different consent rate than organic. If your paid campaigns primarily attract users who do not consent, you lose exactly the data you need for campaign evaluation in GA4. bchic captures it regardless.Combine Consent Segmentation with User Groups to specifically analyze the behavior of visitors without consent and understand what you are missing in other tools.