Overview
Funnel Analysis shows you how many visitors complete each step of a defined conversion path. Unlike Path Analysis – which shows what users actually do – with funnels you define which steps you want to measure yourself. The result is a clear step-by-step view with conversion and drop-off rates for every transition.Create a Funnel
Open Funnel Analysis and click New Funnel. Fill in the following fields:- Name — e.g.
Pricing Checkout Q1 - Description — optional, but helpful when managing multiple funnels
- Time Window (Minutes) — the maximum time allowed between steps for a conversion to be valid. Default: 30 minutes. A user who completes step 1 at 10:00 and step 2 at 10:35 would not be counted as a conversion with this setting.
- Funnel active — inactive funnels are hidden from the overview list
Adjust the time window to match your typical conversion process. A SaaS signup usually takes under 5 minutes – a B2B inquiry can take days. For the latter, consider 1440 minutes (24h) or more.Then define the steps of your funnel. Each step can either be a Page View or an Event:
| Step type | Input | When to use |
|---|---|---|
| Page View | path/to/page | Visitor navigated to a specific URL |
| Event | event_name | Visitor triggered a specific action |
Understanding the Metrics
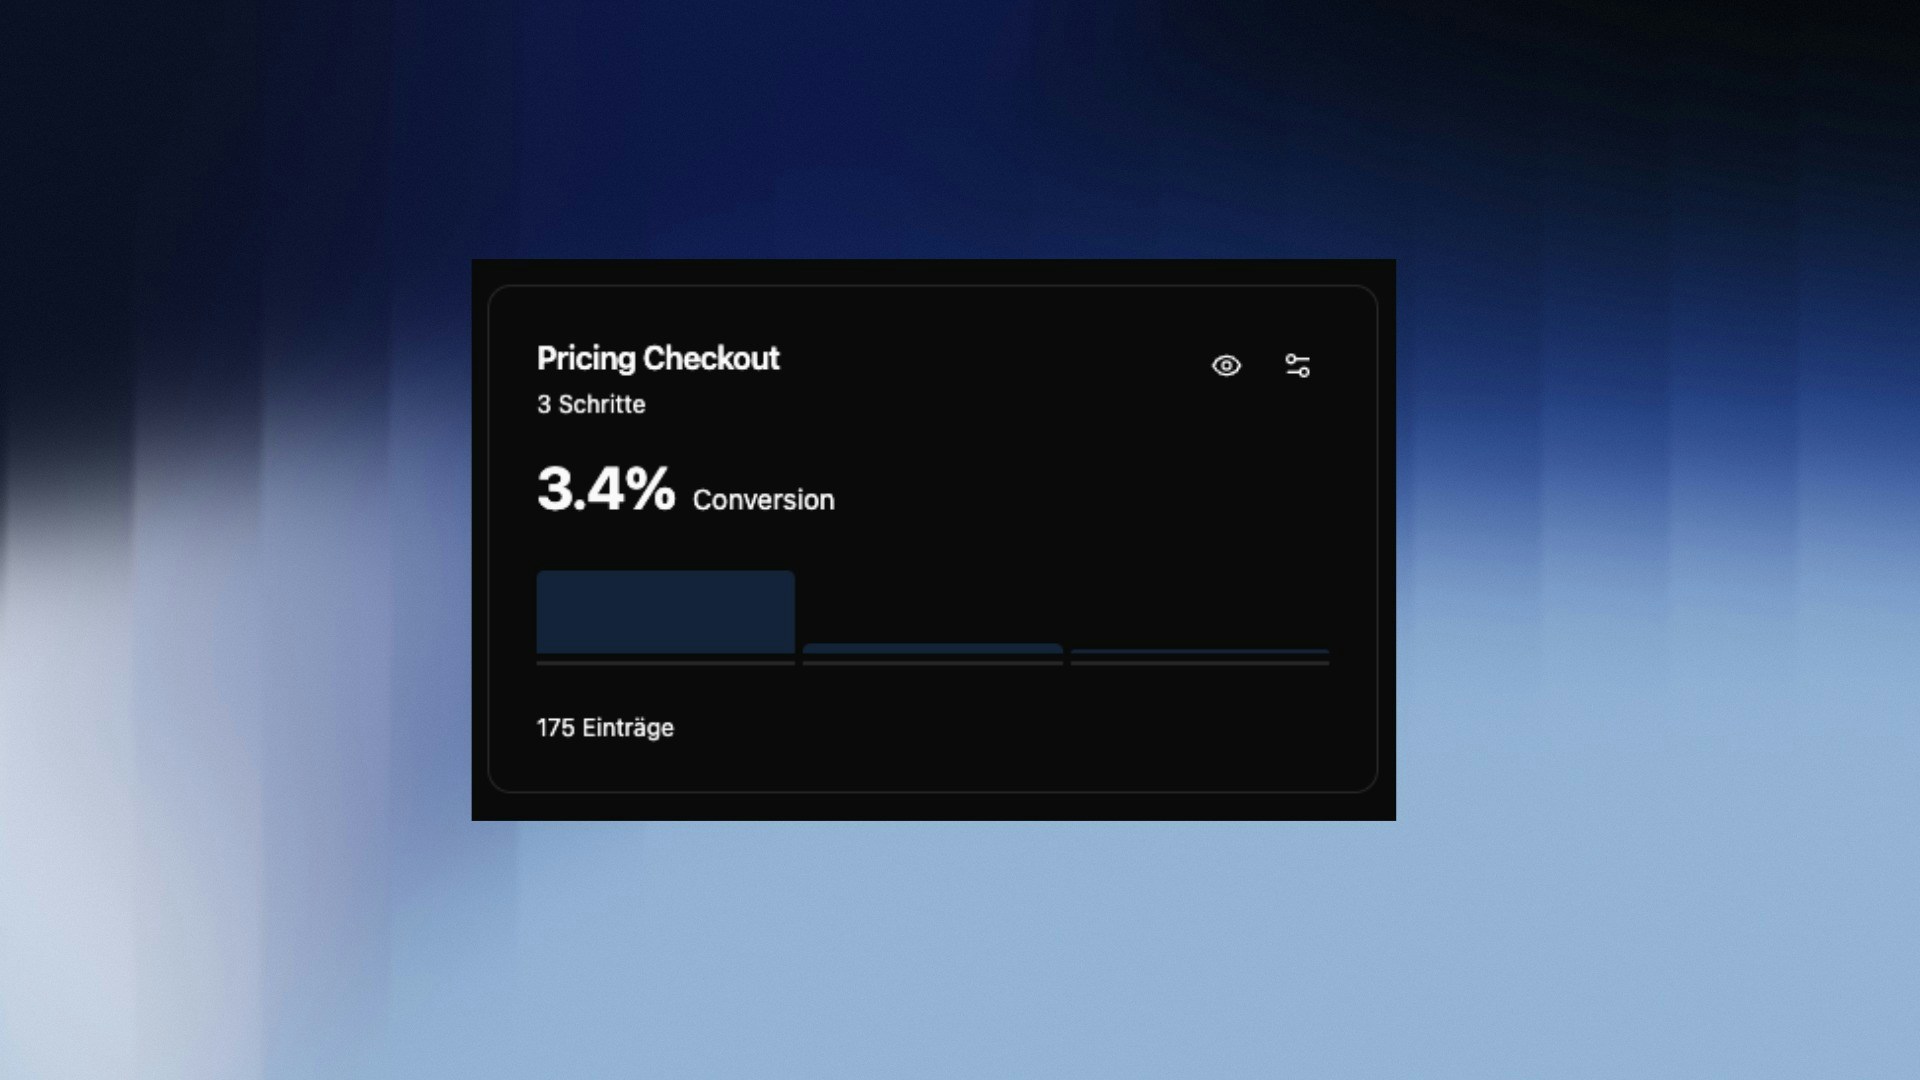
Each saved funnel shows the key numbers directly in the overview list:- Conversion Rate — share of visitors who completed all steps
- Entries — total number of sessions that reached the first step
| Metric | Meaning |
|---|---|
| Overall Conversion Rate | Share of sessions that completed the entire funnel |
| Completed Sessions | Absolute number of successful completions |
| Average Duration | How long users take on average from the first to the last step |
| Biggest Drop-off | The step with the highest percentage loss |
Funnel Visualization
The Funnel Visualization shows each step as a horizontal bar. The width of the blue bar represents the share of sessions that reached this step – relative to the start. For each step you can see:- Sessions — absolute count and percentage rate from start
- Average time spent — how long users spend on this step
- Loss — percentage drop-off compared to the previous step (highlighted in orange)
The biggest drop-off is automatically highlighted in orange – this is your most important optimization signal.
Trend Analysis
Switch to the Trend Analysis tab to see conversions over time as a line chart. This lets you spot whether your conversion rate is improving, declining, or whether there are isolated spikes or dips. You can toggle between the Sessions and Conversion Rate view.Common Analyses
Optimizing the biggest drop-off Look at the step with the highest loss. Combine Funnel Analysis with Path Analysis to understand what users who drop off at that point do instead. Tracking conversion rate over time Use the Trend Analysis after making changes to your website – such as a redesign or a new campaign – to directly measure the impact. Comparing different paths Create multiple funnels for different conversion paths (e.g. Blog → Pricing → Signup vs. Homepage → Pricing → Signup) and compare which route has the higher conversion rate.Combine funnels with User Groups to analyze the path of transactional users in isolation.