> ## Documentation Index
> Fetch the complete documentation index at: https://docs.bchic.de/llms.txt
> Use this file to discover all available pages before exploring further.
# Google Search Console
> Connect your Google Search Console and see clicks, impressions, CTR, and position directly in bchic Analytics.
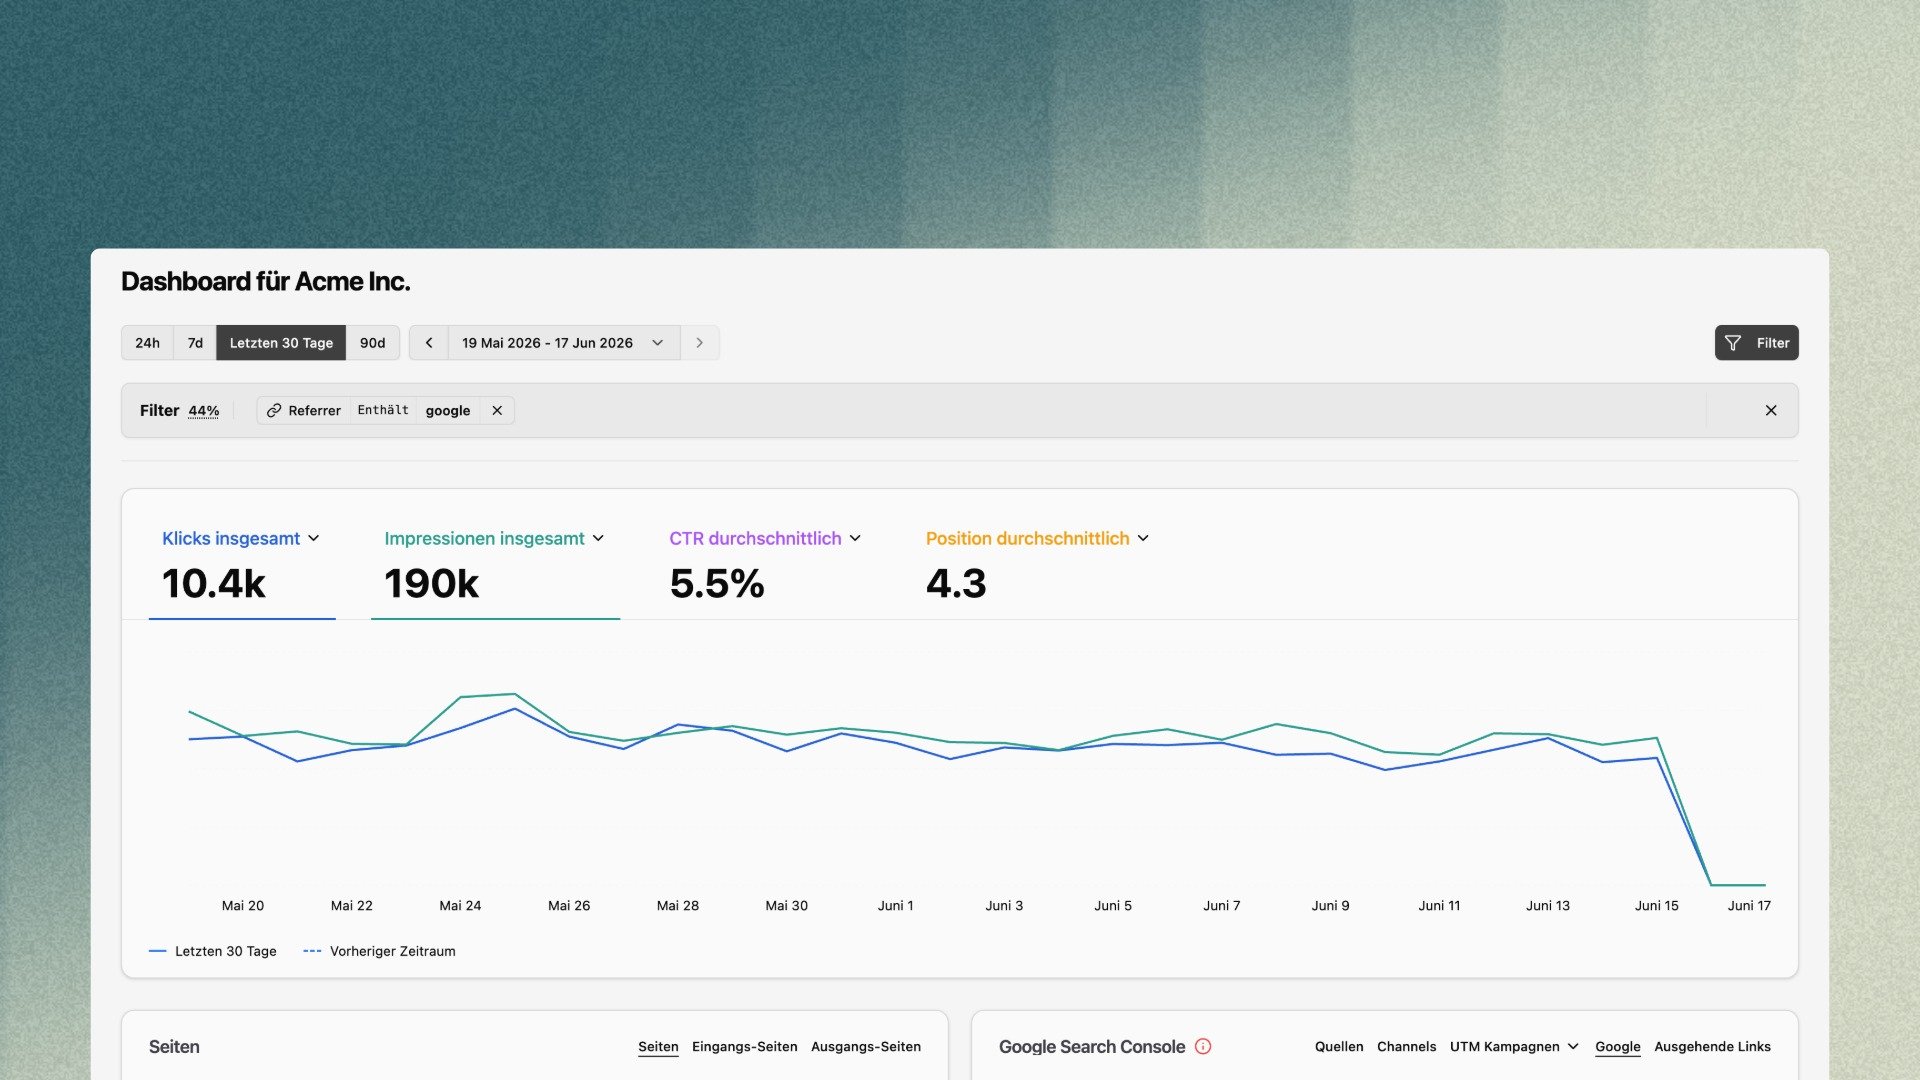 > The Google Search Console integration brings your search data straight into bchic Analytics. See how your pages perform in Google Search – without switching between two tools. And because your bchic filters also apply to the search data, you can connect search performance and on-site behavior in a single view for the first time.
## Setup
You connect it under **Settings → Integrations**:
1. Open **Settings → Integrations** and select **Google Search Console**.
2. Connect your Google account via **OAuth** and confirm access.
3. Choose the property you want to link.
***
## What the integration gives you
Once connected, you get a dedicated **GSC dashboard** with four core metrics:
| Metric | Meaning |
| --------------------- | --------------------------------------------------------------- |
| **Total clicks** | How often users clicked through to your site from Google Search |
| **Total impressions** | How often your pages appeared in search results |
| **Average CTR** | The ratio of clicks to impressions |
| **Average position** | Your average ranking position in search results |
The metrics can be shown as a **time series** and toggled individually. A **previous-period comparison** shows how things have developed versus the prior timeframe.
***
## Dimensions: queries, pages, countries & more
The GSC integration doesn't just show the four metrics – it breaks your search performance down across several dimensions. Each row includes **visitors**, **impressions**, **CTR**, and **position**, and is sortable, searchable, and paginated.
Use the **expand button** to open the detailed view with every dimension as a tab:
| Dimension | What you see |
| --------------------- | ---------------------------------------------------------- |
| **Queries** | The search terms people use to find you |
| **Pages** | Which of your pages rank in search |
| **Countries** | Which countries the search traffic comes from |
| **Devices** | Split across desktop, mobile, and tablet |
| **Search appearance** | How your results appear (e.g. plain results, rich results) |
| **Dates** | Development over time |
***
## Google tab in the sources widget
On the dashboard, the GSC data appears as a dedicated **"Google" tab** in the sources widget – next to **Sources**, **Channels**, **UTM Campaigns**, and **Outbound Links**. The compact view shows your top **search terms** with their metrics; use **expand** to jump into the full dimension view, and the **refresh** icon to pull the latest data. That way your search performance is always in context with the rest of your traffic sources.
***
## Filters also apply to your GSC data
The key difference from Search Console itself: **your bchic filters also work on the Google data.** Filters that map to a GSC dimension – above all **page/path**, but also **country** and **device** – narrow the search data accordingly.
For example: filter on your **home page**, and the Google tab will only show the search terms that page was actually found through. This answers questions that are tedious in Search Console:
* Which keywords is a specific landing page really found through?
* How does a single page perform in search – and does that match its on-site behavior (time on page, conversions)?
Only filters that have a counterpart in the GSC dimensions can be applied. Filters without an equivalent in the Search Console data (e.g. purely behavior-based segments) have no effect on the Google tab.
***
## Permissions
Access is governed by two separate rights (see [Roles & Permissions](/en/settings/admin/roles-permissions)):
* **Use Google Search Console** (capability) — allows viewing the GSC data. Enabled by default for **all roles**.
* **Manage Google Search Console** (admin permission) — allows **setting up and managing** the integration (connecting the Google account, selecting the property).
***
## MCP access
The GSC data is also available through the **MCP server**. This lets you query your search performance in natural language from Claude or Cursor – for example "Which keywords is my home page found through?" or "How has my average position developed this month?".
> The Google Search Console integration brings your search data straight into bchic Analytics. See how your pages perform in Google Search – without switching between two tools. And because your bchic filters also apply to the search data, you can connect search performance and on-site behavior in a single view for the first time.
## Setup
You connect it under **Settings → Integrations**:
1. Open **Settings → Integrations** and select **Google Search Console**.
2. Connect your Google account via **OAuth** and confirm access.
3. Choose the property you want to link.
***
## What the integration gives you
Once connected, you get a dedicated **GSC dashboard** with four core metrics:
| Metric | Meaning |
| --------------------- | --------------------------------------------------------------- |
| **Total clicks** | How often users clicked through to your site from Google Search |
| **Total impressions** | How often your pages appeared in search results |
| **Average CTR** | The ratio of clicks to impressions |
| **Average position** | Your average ranking position in search results |
The metrics can be shown as a **time series** and toggled individually. A **previous-period comparison** shows how things have developed versus the prior timeframe.
***
## Dimensions: queries, pages, countries & more
The GSC integration doesn't just show the four metrics – it breaks your search performance down across several dimensions. Each row includes **visitors**, **impressions**, **CTR**, and **position**, and is sortable, searchable, and paginated.
Use the **expand button** to open the detailed view with every dimension as a tab:
| Dimension | What you see |
| --------------------- | ---------------------------------------------------------- |
| **Queries** | The search terms people use to find you |
| **Pages** | Which of your pages rank in search |
| **Countries** | Which countries the search traffic comes from |
| **Devices** | Split across desktop, mobile, and tablet |
| **Search appearance** | How your results appear (e.g. plain results, rich results) |
| **Dates** | Development over time |
***
## Google tab in the sources widget
On the dashboard, the GSC data appears as a dedicated **"Google" tab** in the sources widget – next to **Sources**, **Channels**, **UTM Campaigns**, and **Outbound Links**. The compact view shows your top **search terms** with their metrics; use **expand** to jump into the full dimension view, and the **refresh** icon to pull the latest data. That way your search performance is always in context with the rest of your traffic sources.
***
## Filters also apply to your GSC data
The key difference from Search Console itself: **your bchic filters also work on the Google data.** Filters that map to a GSC dimension – above all **page/path**, but also **country** and **device** – narrow the search data accordingly.
For example: filter on your **home page**, and the Google tab will only show the search terms that page was actually found through. This answers questions that are tedious in Search Console:
* Which keywords is a specific landing page really found through?
* How does a single page perform in search – and does that match its on-site behavior (time on page, conversions)?
Only filters that have a counterpart in the GSC dimensions can be applied. Filters without an equivalent in the Search Console data (e.g. purely behavior-based segments) have no effect on the Google tab.
***
## Permissions
Access is governed by two separate rights (see [Roles & Permissions](/en/settings/admin/roles-permissions)):
* **Use Google Search Console** (capability) — allows viewing the GSC data. Enabled by default for **all roles**.
* **Manage Google Search Console** (admin permission) — allows **setting up and managing** the integration (connecting the Google account, selecting the property).
***
## MCP access
The GSC data is also available through the **MCP server**. This lets you query your search performance in natural language from Claude or Cursor – for example "Which keywords is my home page found through?" or "How has my average position developed this month?".