> ## Documentation Index
> Fetch the complete documentation index at: https://docs.bchic.de/llms.txt
> Use this file to discover all available pages before exploring further.
# Path Analysis
> Track your visitors navigation paths step by step – see where they enter, where they go, and where they drop off.
 ## Overview
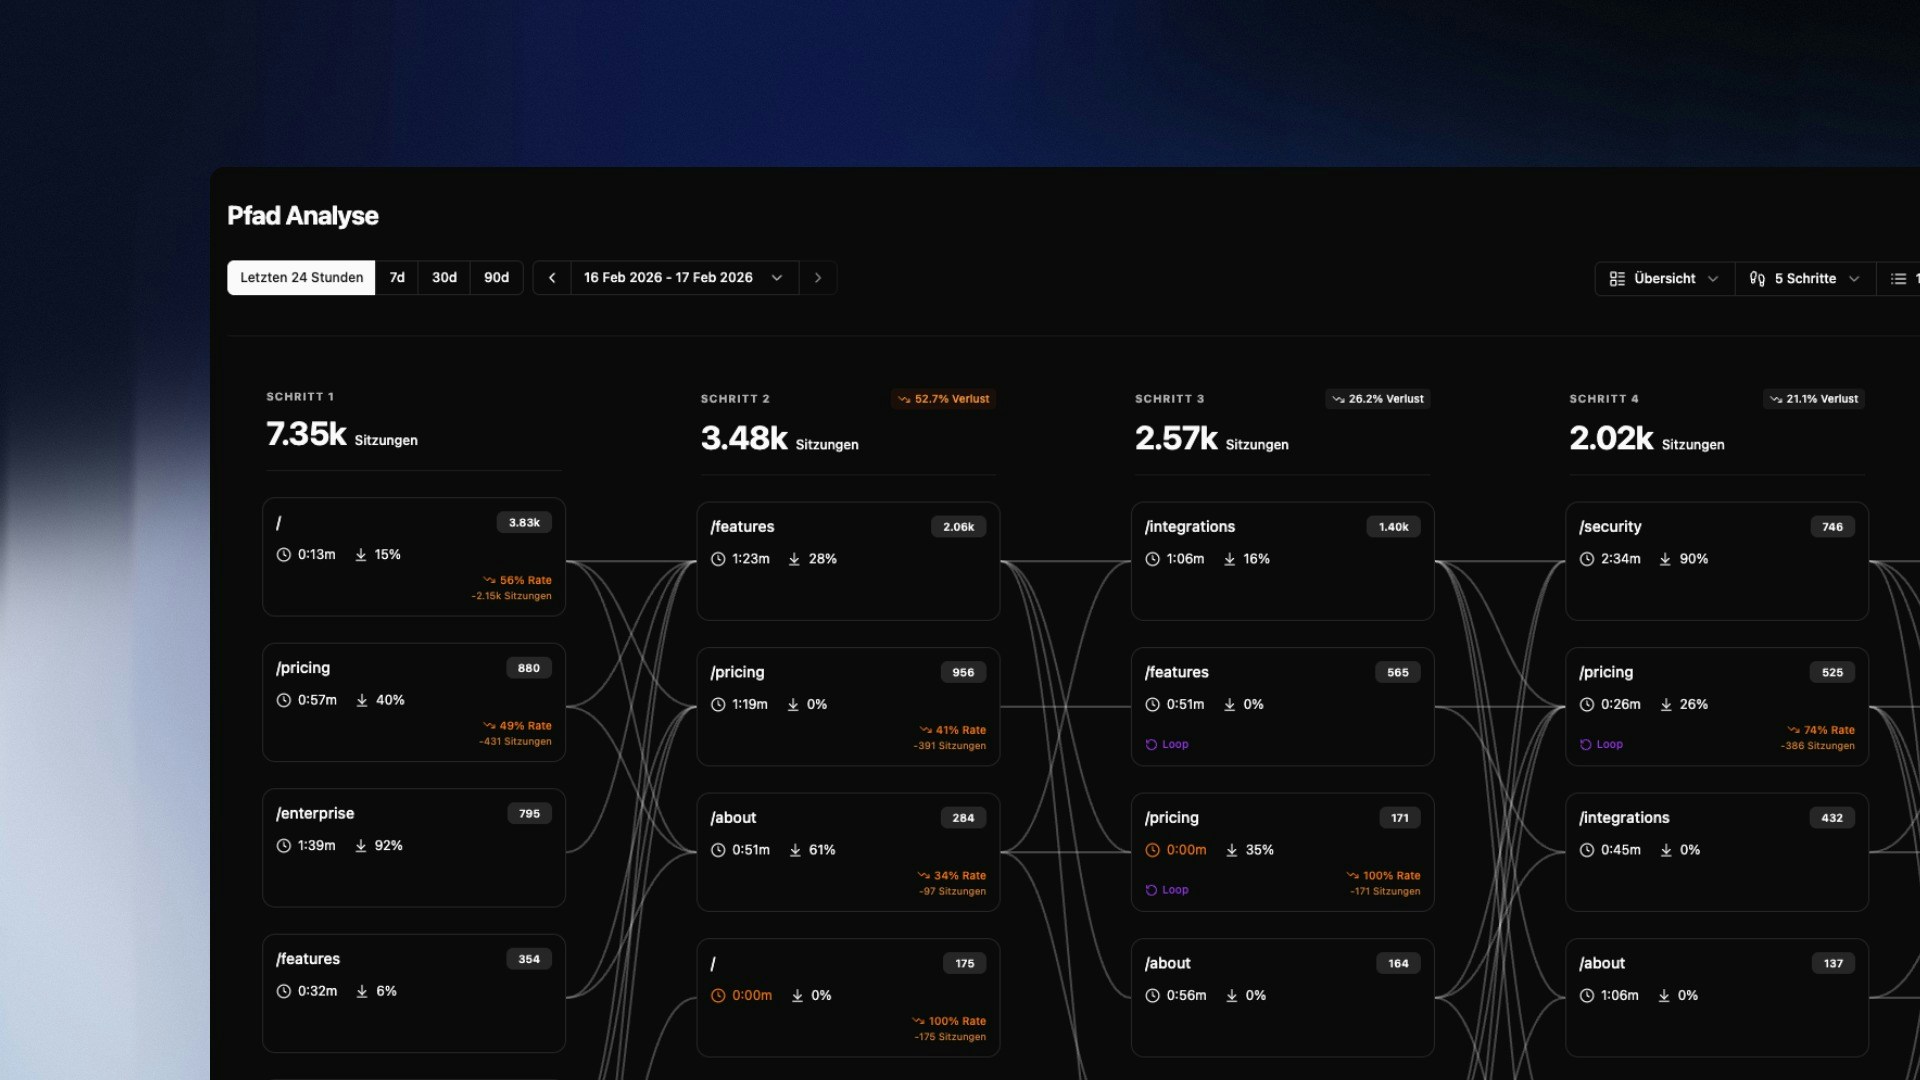
Path Analysis visualizes the most common navigation routes of your visitors as a Sankey diagram. Each column represents one interaction step – from the entry page to several clicks deep into the session. The connecting lines between columns show how visitors flow from one page to the next.
At a glance you can see: where users enter, which paths lead to conversion, and where sessions drop off.
***
## Reading the Diagram
Each box in a column represents a page and shows three metrics:
| Metric | Meaning |
| -------------------- | ------------------------------------------------------ |
| **Number top right** | Number of sessions that reached this page at this step |
| **Clock icon** | Average time spent on this page |
| **Arrow icon** | Bounce rate for this page |
Above each column you'll see the total session count for that step and the percentage loss compared to the previous step. A loss of **52.7%** between step 1 and step 2 means more than half of all visitors ended their session after the first step.
> A **Loop** label on a page means visitors returned to it multiple times within the same session – a signal of either disorientation or active re-engagement with important content.
***
## Controls & Views
## Overview
Path Analysis visualizes the most common navigation routes of your visitors as a Sankey diagram. Each column represents one interaction step – from the entry page to several clicks deep into the session. The connecting lines between columns show how visitors flow from one page to the next.
At a glance you can see: where users enter, which paths lead to conversion, and where sessions drop off.
***
## Reading the Diagram
Each box in a column represents a page and shows three metrics:
| Metric | Meaning |
| -------------------- | ------------------------------------------------------ |
| **Number top right** | Number of sessions that reached this page at this step |
| **Clock icon** | Average time spent on this page |
| **Arrow icon** | Bounce rate for this page |
Above each column you'll see the total session count for that step and the percentage loss compared to the previous step. A loss of **52.7%** between step 1 and step 2 means more than half of all visitors ended their session after the first step.
> A **Loop** label on a page means visitors returned to it multiple times within the same session – a signal of either disorientation or active re-engagement with important content.
***
## Controls & Views
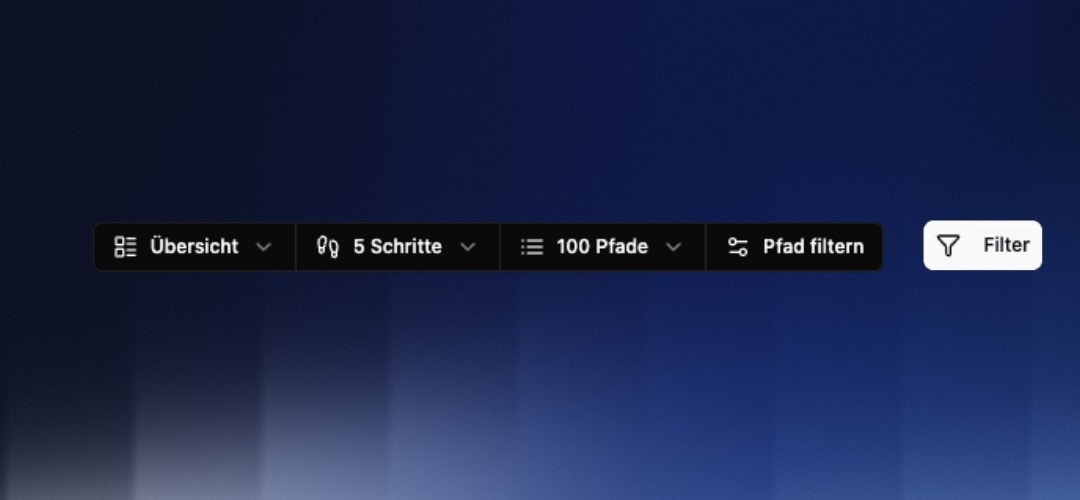 The toolbar in the top right gives you four levers for your analysis:
**View Mode**
Switch between three views:
* **Overview** — All paths in the standard display
* **Losses** — Highlights pages with high drop-off rates (shown in orange)
* **Loops** — Shows only pages that users return to multiple times (shown in purple)
**Analysis Depth**
Choose between 3 and 7 steps. More steps reveal longer sessions but can reduce clarity. 5 steps is a good starting point for most websites.
**Number of Paths**
Control how many pages are shown per column: 100, 250, 500, or 1,000 paths. Less common paths are grouped into a **"X more pages..."** summary by default.
**Path Configuration**
Define a specific start and end point for the analysis:
* **Start point** — e.g. `/pricing` to see only paths that begin on the pricing page
* **Target page** — e.g. `/checkout` to work backwards and see which routes lead to checkout
***
## Expanding Grouped Pages
When a column contains many low-traffic pages, they are combined into a **"X more pages..."** box. Click **Details** to expand the full list and see all grouped URLs with their session counts.
Individual URLs can be unpinned directly from the group – they'll then appear as their own box in the diagram.
***
## Events in the Path
Path Analysis now shows **events visually right in the path** – such as outbound link clicks. This way you see not only *which* pages visitors move through, but also *where* in the journey an event is triggered and *how often*.
Clicking a step opens the **event details** with the associated target URLs and their frequency. At a glance you can tell at which point in the journey users click an external link, for example – and how often.
***
## Saved Journeys
A configured path analysis (start and end point, depth, view mode) can be stored as a **saved journey** and recalled later with a single click. This means you don't have to rebuild recurring analyses – such as your most important conversion path – from scratch every time.
***
## Common Analyses
**Finding drop-off points**
A high loss between two steps shows where sessions end. Is the transition unclear? Is a call-to-action missing? Combine the Losses view with a filter to directly address the affected pages.
**Reconstructing conversion paths**
Set your checkout or thank-you page as the target in Path Configuration. The diagram will show you in reverse which routes users actually take to convert.
**Understanding loop behavior**
Loops on navigation pages (e.g. `/`) are a warning sign – users aren't finding what they're looking for. Loops on content pages can be positive, indicating high relevance.
> Combine Path Analysis with User Groups to view conversion paths of transactional users in isolation.
The toolbar in the top right gives you four levers for your analysis:
**View Mode**
Switch between three views:
* **Overview** — All paths in the standard display
* **Losses** — Highlights pages with high drop-off rates (shown in orange)
* **Loops** — Shows only pages that users return to multiple times (shown in purple)
**Analysis Depth**
Choose between 3 and 7 steps. More steps reveal longer sessions but can reduce clarity. 5 steps is a good starting point for most websites.
**Number of Paths**
Control how many pages are shown per column: 100, 250, 500, or 1,000 paths. Less common paths are grouped into a **"X more pages..."** summary by default.
**Path Configuration**
Define a specific start and end point for the analysis:
* **Start point** — e.g. `/pricing` to see only paths that begin on the pricing page
* **Target page** — e.g. `/checkout` to work backwards and see which routes lead to checkout
***
## Expanding Grouped Pages
When a column contains many low-traffic pages, they are combined into a **"X more pages..."** box. Click **Details** to expand the full list and see all grouped URLs with their session counts.
Individual URLs can be unpinned directly from the group – they'll then appear as their own box in the diagram.
***
## Events in the Path
Path Analysis now shows **events visually right in the path** – such as outbound link clicks. This way you see not only *which* pages visitors move through, but also *where* in the journey an event is triggered and *how often*.
Clicking a step opens the **event details** with the associated target URLs and their frequency. At a glance you can tell at which point in the journey users click an external link, for example – and how often.
***
## Saved Journeys
A configured path analysis (start and end point, depth, view mode) can be stored as a **saved journey** and recalled later with a single click. This means you don't have to rebuild recurring analyses – such as your most important conversion path – from scratch every time.
***
## Common Analyses
**Finding drop-off points**
A high loss between two steps shows where sessions end. Is the transition unclear? Is a call-to-action missing? Combine the Losses view with a filter to directly address the affected pages.
**Reconstructing conversion paths**
Set your checkout or thank-you page as the target in Path Configuration. The diagram will show you in reverse which routes users actually take to convert.
**Understanding loop behavior**
Loops on navigation pages (e.g. `/`) are a warning sign – users aren't finding what they're looking for. Loops on content pages can be positive, indicating high relevance.
> Combine Path Analysis with User Groups to view conversion paths of transactional users in isolation.