> ## Documentation Index
> Fetch the complete documentation index at: https://docs.bchic.de/llms.txt
> Use this file to discover all available pages before exploring further.
# Change Impact Analysis
> Measure the exact impact of changes (deployments, marketing, content) on your most important KPIs.
 ## Overview
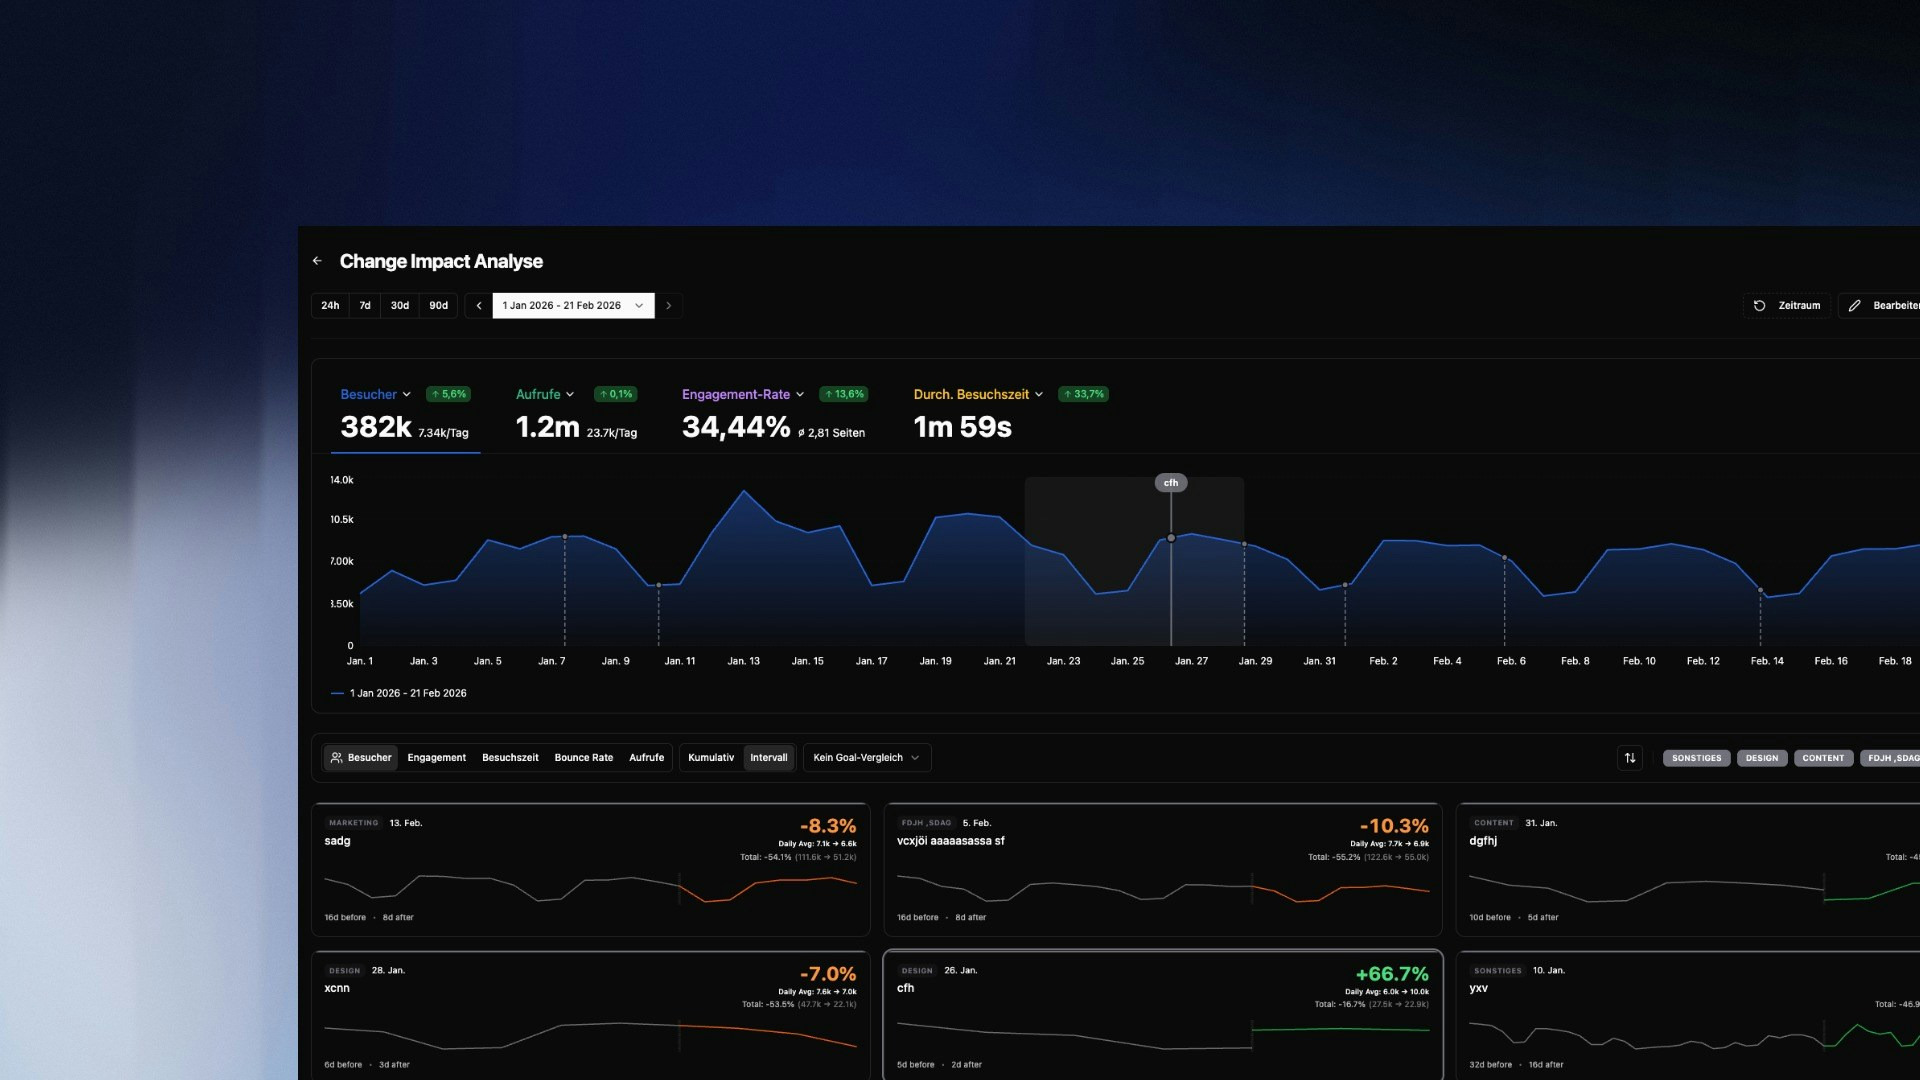
Change Impact Analysis (CIA) answers the most critical question after any change: **"What was the actual return?"**
Instead of manually comparing timeframes or guessing whether a traffic spike was caused by your newsletter or pure coincidence, CIA quantifies the effect precisely. You mark a point in time (e.g., a deployment or campaign start), and bchic Analytics calculates the metric changes in a before-and-after comparison.
This is particularly valuable for:
* **Product Teams:** Measuring the ROI of new features.
* **Marketing:** Analyzing the sustainability of campaign traffic.
* **Engineering:** Monitoring performance metrics (e.g., load time) after updates.
***
## Creating Impact Events
To start an analysis, define a **Change Event**. This is the "zero point" from which measurement begins.
## Overview
Change Impact Analysis (CIA) answers the most critical question after any change: **"What was the actual return?"**
Instead of manually comparing timeframes or guessing whether a traffic spike was caused by your newsletter or pure coincidence, CIA quantifies the effect precisely. You mark a point in time (e.g., a deployment or campaign start), and bchic Analytics calculates the metric changes in a before-and-after comparison.
This is particularly valuable for:
* **Product Teams:** Measuring the ROI of new features.
* **Marketing:** Analyzing the sustainability of campaign traffic.
* **Engineering:** Monitoring performance metrics (e.g., load time) after updates.
***
## Creating Impact Events
To start an analysis, define a **Change Event**. This is the "zero point" from which measurement begins.
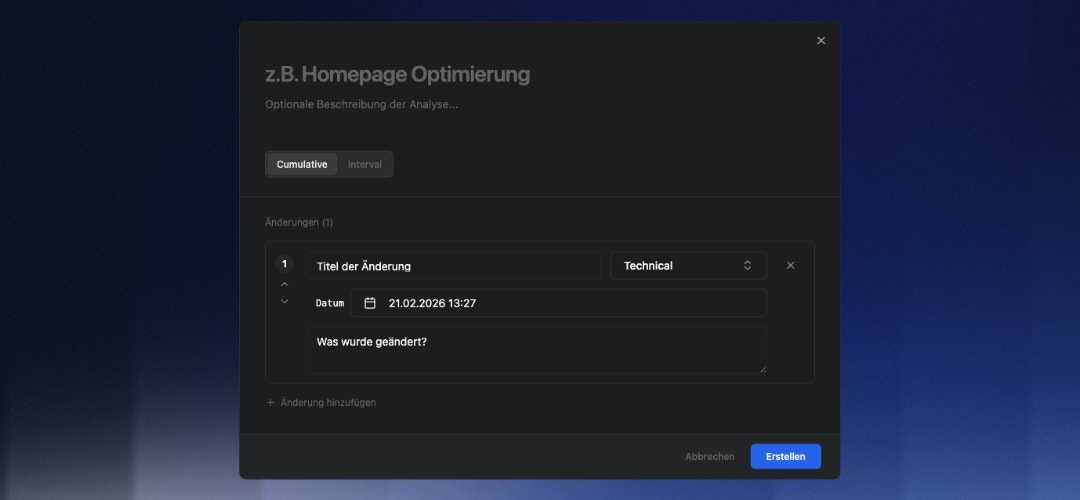 Click `+ Add Change` in the overview and fill in the details:
* **Title & Description:** What changed? (e.g., "Homepage Redesign v2").
* **Category:** Choose from `Technical`, `Marketing`, `Content`, `Design`, or `Experiment`. This helps with filtering later.
* **Timestamp:** The exact date and time the change went live.
> **Tip:** Be as precise as possible with the timestamp. The more accurately the start point is defined, the sharper the distinction between "before" and "after" in the data.
***
## The Analysis Card
Once an event is created, the system generates an Impact Card ("Scorecard") below the main graph. This card is the core of the evaluation.
Click `+ Add Change` in the overview and fill in the details:
* **Title & Description:** What changed? (e.g., "Homepage Redesign v2").
* **Category:** Choose from `Technical`, `Marketing`, `Content`, `Design`, or `Experiment`. This helps with filtering later.
* **Timestamp:** The exact date and time the change went live.
> **Tip:** Be as precise as possible with the timestamp. The more accurately the start point is defined, the sharper the distinction between "before" and "after" in the data.
***
## The Analysis Card
Once an event is created, the system generates an Impact Card ("Scorecard") below the main graph. This card is the core of the evaluation.
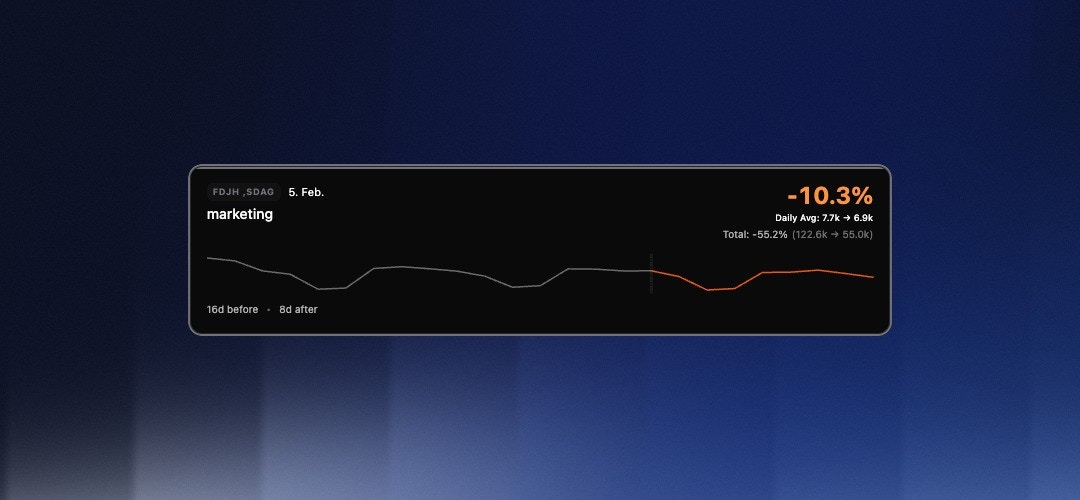 Each card shows you at a glance:
1. **Percentage Change:** The large number (e.g., `+8.6%`) shows the difference in the selected metric compared to the previous period.
2. **Trend Graph:** The white line shows actual performance after the event. The gray line visualizes the trend *before* the event for comparison.
3. **Total & Average:**
* **Daily Avg:** The average daily value (Before vs. After).
* **Total:** The absolute sum of interactions in the compared periods.
***
## Quick Start with Templates
To minimize setup effort, CIA offers pre-configured templates for common use cases. When adding a change, simply select a template:
### Interval Template
*“How are my metrics changing over time?”*
Automatically generates recurring impact markers based on a fixed schedule (e.g., every X days, weekly, or monthly).
**Use Case:** Ideal for continuous monitoring or establishing weekly reporting cycles without manually creating events.
### Campaign Template
*“Did my last campaign actually move the needle?”*
Scans your historical UTM data from the past year to automatically detect campaigns. Select the desired campaigns from the list, and the system instantly creates the corresponding impact markers.
**Use Case:** Immediate, retrospective evaluation of marketing efforts. Filterable by `Paid`, `Organic`, and `Min. Clicks`.
***
## Goal Comparison & A/B Testing
Beyond general metrics (like visitors or views), you can measure how changes affect specific conversion goals. Using the **"Goal Comparison"** dropdown, you can place two goals side-by-side to directly compare their performance (A/B Testing).
**How to set up a Goal Comparison:**
1. **Define Goal:** Open the main filter bar (`Y`) at the top right and set the conditions that define your conversion goal (e.g., *Visited Page = /checkout/success*).
2. **Save Goal:** Click the save icon and ensure you select the category "Conversion-Ziel" (Conversion Goal).
3. **Compare:** Select your saved goal from the dropdown in the CIA dashboard.
**Use Case:** A/B Testing. Place two distinct conversion paths or user segments next to each other. After an event occurs, you instantly see whether Variant A or Variant B had a more positive impact.
***
## Cumulative vs. Interval
You can switch the calculation mode in the top left of the dashboard. The choice depends on your objective:
### Interval (Phase Comparison)
Focuses exactly on the phase from the **start of the change to the next change** (or until today, if no subsequent change follows).
* **Comparison:** This period is compared against a baseline of **twice the duration** prior to the event.
* **Goal:** Isolates the effect of a specific version or campaign before the next factor (next marker) interferes. Ideal for checking stability between two deployments.
### Cumulative (Total Impact)
Continuously sums up the effect since the start time, ignoring subsequent markers.
* **Goal:** Shows the absolute "yield" (e.g., total additional conversions) over the entire runtime.
***
## Comparison Periods & Filters
Vertical dashed lines mark your Change Events. Clicking an Impact Card highlights the corresponding period in the main graph. This lets you immediately see if a change correlates with global trends or had an isolated impact.
Use the **Category Filters** (top right above the cards) to, for example, show only `Marketing` events and hide technical deployments.
***
## Impact on Performance & Google Search
Beyond the classic traffic and conversion metrics, Change Impact Analysis now also measures how each marker affects technical performance and visibility in Google Search.
* **Core Web Vitals:** For each marker you see the change in Core Web Vitals (e.g. **LCP**). This lets you immediately tell whether a deployment improved or degraded load performance.
* **Google Search Performance:** For each marker, the core GSC metrics are reported in a before-and-after comparison – **clicks**, **impressions**, **CTR**, and **position**. This lets you quantify the SEO effect of a change directly.
The Google Search performance data comes from the [Google Search Console integration](en/settings/google-search-console) and is available from the Growth plan.
> **MCP:** The impact data is also available via the MCP server – so you can query it using natural language in Claude or Cursor. See [Available Tools & Questions](/en/plattform/ai/mcp-tools).
***
## Typical Analyses
**Did the redesign improve user retention?**
Create a `Design` category event. Select "Engagement Rate" or "Avg. Visit Duration" as the metric. A positive green value confirms the new UI keeps users engaged longer.
**Is the paid campaign worth it?**
Mark the ad start as a `Marketing` event. Switch to "Cumulative" and observe the "Visitors" metric. Compare the increase ("Total") with your ad spend to roughly estimate CPA (Cost per Acquisition).
**Monitor performance after deployment**
Create a `Technical` event after every release. Monitor "Bounce Rate" and "Views". A sudden spike in Bounce Rate immediately after the event often indicates technical errors or 404 issues.
Each card shows you at a glance:
1. **Percentage Change:** The large number (e.g., `+8.6%`) shows the difference in the selected metric compared to the previous period.
2. **Trend Graph:** The white line shows actual performance after the event. The gray line visualizes the trend *before* the event for comparison.
3. **Total & Average:**
* **Daily Avg:** The average daily value (Before vs. After).
* **Total:** The absolute sum of interactions in the compared periods.
***
## Quick Start with Templates
To minimize setup effort, CIA offers pre-configured templates for common use cases. When adding a change, simply select a template:
### Interval Template
*“How are my metrics changing over time?”*
Automatically generates recurring impact markers based on a fixed schedule (e.g., every X days, weekly, or monthly).
**Use Case:** Ideal for continuous monitoring or establishing weekly reporting cycles without manually creating events.
### Campaign Template
*“Did my last campaign actually move the needle?”*
Scans your historical UTM data from the past year to automatically detect campaigns. Select the desired campaigns from the list, and the system instantly creates the corresponding impact markers.
**Use Case:** Immediate, retrospective evaluation of marketing efforts. Filterable by `Paid`, `Organic`, and `Min. Clicks`.
***
## Goal Comparison & A/B Testing
Beyond general metrics (like visitors or views), you can measure how changes affect specific conversion goals. Using the **"Goal Comparison"** dropdown, you can place two goals side-by-side to directly compare their performance (A/B Testing).
**How to set up a Goal Comparison:**
1. **Define Goal:** Open the main filter bar (`Y`) at the top right and set the conditions that define your conversion goal (e.g., *Visited Page = /checkout/success*).
2. **Save Goal:** Click the save icon and ensure you select the category "Conversion-Ziel" (Conversion Goal).
3. **Compare:** Select your saved goal from the dropdown in the CIA dashboard.
**Use Case:** A/B Testing. Place two distinct conversion paths or user segments next to each other. After an event occurs, you instantly see whether Variant A or Variant B had a more positive impact.
***
## Cumulative vs. Interval
You can switch the calculation mode in the top left of the dashboard. The choice depends on your objective:
### Interval (Phase Comparison)
Focuses exactly on the phase from the **start of the change to the next change** (or until today, if no subsequent change follows).
* **Comparison:** This period is compared against a baseline of **twice the duration** prior to the event.
* **Goal:** Isolates the effect of a specific version or campaign before the next factor (next marker) interferes. Ideal for checking stability between two deployments.
### Cumulative (Total Impact)
Continuously sums up the effect since the start time, ignoring subsequent markers.
* **Goal:** Shows the absolute "yield" (e.g., total additional conversions) over the entire runtime.
***
## Comparison Periods & Filters
Vertical dashed lines mark your Change Events. Clicking an Impact Card highlights the corresponding period in the main graph. This lets you immediately see if a change correlates with global trends or had an isolated impact.
Use the **Category Filters** (top right above the cards) to, for example, show only `Marketing` events and hide technical deployments.
***
## Impact on Performance & Google Search
Beyond the classic traffic and conversion metrics, Change Impact Analysis now also measures how each marker affects technical performance and visibility in Google Search.
* **Core Web Vitals:** For each marker you see the change in Core Web Vitals (e.g. **LCP**). This lets you immediately tell whether a deployment improved or degraded load performance.
* **Google Search Performance:** For each marker, the core GSC metrics are reported in a before-and-after comparison – **clicks**, **impressions**, **CTR**, and **position**. This lets you quantify the SEO effect of a change directly.
The Google Search performance data comes from the [Google Search Console integration](en/settings/google-search-console) and is available from the Growth plan.
> **MCP:** The impact data is also available via the MCP server – so you can query it using natural language in Claude or Cursor. See [Available Tools & Questions](/en/plattform/ai/mcp-tools).
***
## Typical Analyses
**Did the redesign improve user retention?**
Create a `Design` category event. Select "Engagement Rate" or "Avg. Visit Duration" as the metric. A positive green value confirms the new UI keeps users engaged longer.
**Is the paid campaign worth it?**
Mark the ad start as a `Marketing` event. Switch to "Cumulative" and observe the "Visitors" metric. Compare the increase ("Total") with your ad spend to roughly estimate CPA (Cost per Acquisition).
**Monitor performance after deployment**
Create a `Technical` event after every release. Monitor "Bounce Rate" and "Views". A sudden spike in Bounce Rate immediately after the event often indicates technical errors or 404 issues.